During the coronavirus epidemic, the belgian federal group of scientific experts came up regularly in the official communication of the government. How can scientists understand the spread of an epidemic? By using a model: a mathematical description of a phenomenon. By varying the parameters of the model, one can test new situations from a theoretical perspective.
Most scientific theories start their life as models, some of which ultimately becoming more fundamental as they withstand experimental tests. One of the most famous models is probably classical mechanics: the principles and equations laid out by Sir Isaac Newton on the movement of bodies. We know today that this theory is superseded by quantum mechanics or by general relativity depending on the problem at hand (until now, physicists have not found how to reconcile both theories). In its domain of validity, however, classical mechanics remain fully adequate, such as in the guiding of rockets and satellites or in the study of protein structure.
I start by introducing what is a model and present afterwards a model of mathematical epidemiology that some scientists have used in the context of the coronavirus crisis.
Note: This text was originally written in French in april 2020 for the magazine "La Revue nouvelle" under the title "Vous avez dit modèle?".
A toy model for a toy model
Scientists like to call the simplest of models "toy models". The interest of this method is not to obtain quantitative results but to understand the principle underlying a phenomenon for research of pedagogic purposes. I will present a toy model as the first topic of this article.
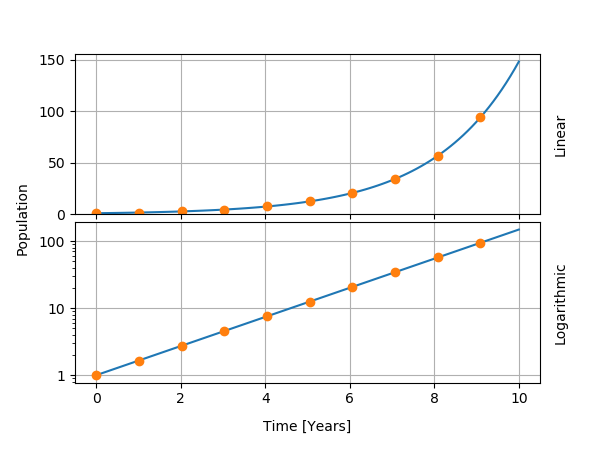
Let us focus on the phenomenon of birth and make the following hypothesis: the number of births at any point in time is proportional to the size P of the population. Then, we can write the variation of the population as the product of P with the average number of child per person. The solution to this model is very simple, it is the famous exponential function. We can thus compute the size of the population as a function of time. We can also deduce that the population will double at predictable time intervals.
What are the limits of the model? 1. There is no maximal value: the world's population could well reach a billion billion people! 2. Every individual is assumed to be identical, without nuance for the variation in fertility from one region to another for instance.
On the other hand, some teachings of this model can be transferred. First, the very definition of the reproduction rate is useful to build more sophisticated models. Second, the mathematical formula for the population shows as a line on so-called logarithmic plots. For this reason, many graphics have a scale of the type "1, 10, 100, 1000" (logarithmic) instead of "1, 2, 3, 4" (linear). I show the exponential function in both types of graphics below.

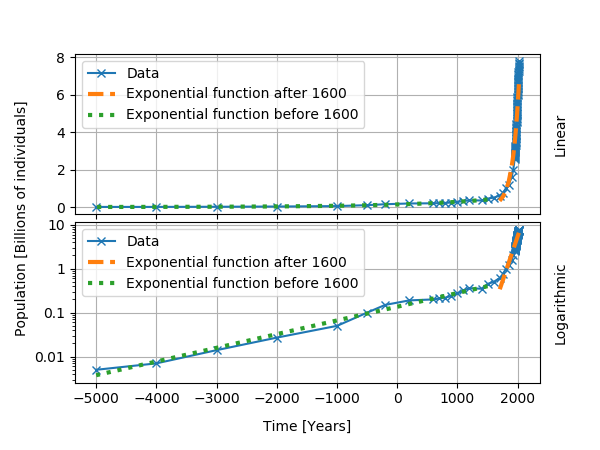
World population, for several historical epochs, followed an approximatively exponential growth. I show the data below, with exponential curves fitted for two time intervals. From the start of the data in 5000 BC to about 1600 AD, we obtained a doubling time of about 1000 years and a growth rate of about 0.07% per year. After 1600 AD, the growth rate reaches 0.9% per year and the doubling time is 74 years. Even though the population does not follow an exponential growth, the use of a logarithmic plot and the analysis in terms of the doubling time help for the understanding of the data.

A model for epidemiology
The spread of a viral epidemic can often be described by a model. Chinese researchers have used the so-called SEIR model that classifies individuals as susceptible (S), exposed (E), infected (I), and recovered (R). The mathematical model defines the variation of the number of individuals in each of those categories, by providing a mathematical formula for the time derivative of each of them. Then, one must provide a value for a set of parameters that corresponds to the disease (time of incubation and recovery, reproduction rate). In the simplified model, one can omit the natural death rate of the population, which is a fair approximation for short-lived epidemics.
At the beginning of the epidemic, almost all of the population is considered susceptible to exposure by infected individuals (the infection itself arises after exposure). The number of exposed individuals thus increases in proportion to the pool of susceptible individuals and to the number of infected individuals.
Once the mathematics is all written down, one must solve the equations. Sometimes it is possible to obtain a direct mathematical formula. Most often, however, scientists use the computer to obtain a numerical solution that can be displayed and analyzed in detail. For the SEIR model, I performed several epidemiologic simulations via such a method. Motivated by the tweets of Nicolas Vandewalle, I used the article from the school of public health of Shanghai Jiao (Tong University School of Medicine) in which the chinese scientists provide parameter estimates for the COVID-19. One of the parameters, the reproduction coefficient R0, depends strongly on individuals' behaviours (closeness, social encounters, etc) and cannot be determined in a universal manner.
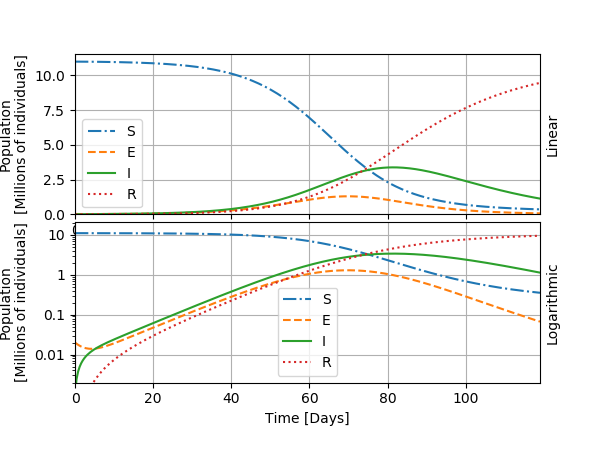
I show the graphic below an example with one curve for each category in the model.

The general evolution of the epidemic, visible in this first graph, goes as follows: the number of exposed individuals grows strongly, followed by the number of infected individuals with some delay, until it reaches a maximal value: the peak of the epidemic. The growth in I is exponential during the days 10 to 50, approximatively, and thus shows as a line on the logarithmic graph. We can thus also define a doubling time for the number of infected individuals, as we did for the toy model for the world population. After the peak, the infected become recovered and are supposed immunized. The worst of the outbreak is over. The number of persons who need intensive care or who die from the infection is generally considered a fixed fraction of I. In the next graphics, I will only show the curves for I.
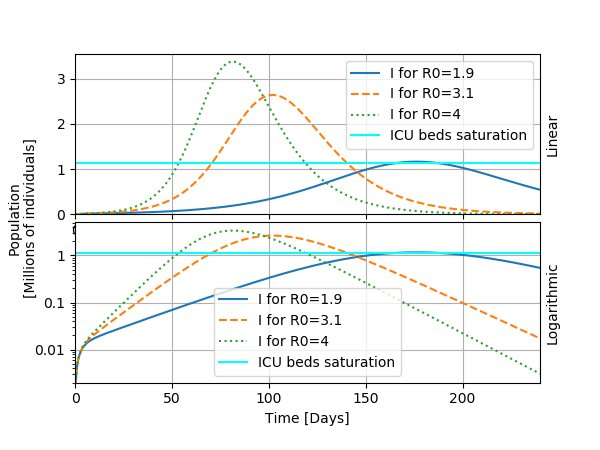
I will now show a typical usage of the model, which is to investigate the possible outcomes for several values of the parameter R0. To do so, I display the curve "I" as a function of time for the bounds for R0 given in the article: R0=1.9 and R0=3.1. I add to these estimates R0=4 that seems consistent for the early evolution of the epidemic in Belgium.

From this study, we can observe the following: changing R0 modifies significantly the heigth and the timing of the peak of the epidemic. This has consequences for public health because the heigth of the peak determines whether the health care system saturates or not: a fraction of the infected individuals will need a bed in a intensive care unit. If the epidemic passes this treshold, the situation becomes critical as we have seen in Italy for instance. For a sligthly idealized case, I draw a horizontal bar denoting the treshold for saturating ICU beds at about 1.14 millions infected individuals (only a fraction of those will end up at the ICU). This highlights the now famous "flattening the curve" effect that appeared in the media: by taking appropriate measures to slow the spread of the virus, the scenario of the epidemic can be handled better.
Once the epidemic has started, we can unfortunately start to compare the results of the model with the collected statistics. This part of the work enables us to calibrate the model, i.e. to verify and update the parameters. The model -- and the exploration of hypothetical scenarios -- becomes a tool to help in decision making and also serves as a basis to analyze the data and assess whether we are flattening the curve.
In the case of the coronavirus, several observations have been made about the quality of the data. The first is that there is a huge discrepancy between the number of individuals actually infected and the number of positive test results, the latter being likely much lower than the former. One possible solution is to consider the two quantities as being proportional and to correct the data accordingly. The second observation is that a large part of the infected people does not show any symptom (one speaks of asymptomatic cases), and that this makes it difficult to know the actual spread of the virus in the country. By considering these corrections to the data, we obtain a more realistic view on the epidemic.
The SEIR model presented above only considers the number of individuals in the categories S, E, I, and R. Therefore, the model and all observations drawn from it disregards entirely the societal structure in terms of age and geography, among others. The theory of networks is a suitable framework to fill in the gap: by representing individuals as nodes in the network and their relations as edges of the resulting graph, one can model the contacts between individuals as a function of their location and age.
As we improve the descriptive ability of the model, it is too easy to forget about the underlying hypotheses and the domain of validity of the mathematical representation. It becomes tempting to blur the line between the model and reality, and to grant an exagerated predictive force to the model. At this moment, it is the role of the expert (either the domain expert or the modeling expert, ideally both of them) to exercise critical thinking and to recall those limitations to their partners.
All models are wrong, but some are useful
The title of this section refers to a saying attributed to the statistician George Box. By establishing a mathematical description of a phenomenon, scientists rely on hypotheses and tolerate approximations, which would suffice to discard the model. One can however build a fundamental understanding of certain natural phenomena thanks to these simplifications. The saying thus serves as an important reminder more than as a blind critique of modeling per se. Public policy makers should not use a model to inform decision making while neglecting the limits exposed here, especially in relation to public health. For them to ignore the observations of the models would be as unfortunate
I will now apply the critical analysis to the epidemic model. What can we learn from it? What are its limits? At first, we can conclude that diminishing the spreading velocity of the disease diminishes the maximum number of infected individuals at any given time. As a consequence, the duration of application of preventive measures must increase. The cumulative, or total, number of infected individuals during the epidemic is of about 90% is most scenarios, thereby confirming the message that flattening the curve mostly serves to avoid the saturation of the health care system. The basis hypothesis for these scenarios is that one can influence the reproduction rate R0 by mandating measures such as home confinement and school closures, following the relevant scientific literature. Also, the interpretation of the daily statistics will benefit from a comparison to the model, underlining its relevance as a reference point.
From the point of view of limitations, it is useful to remember that the model presented above is an approximation that reduces the relations of millions of individuals to four mathematical variables and three parameters. Among those, R0 varies as a function of the country and of time, and must be calibrated accordingly. The differences in the age-pyramid, in the immunity and in the social behavior are all neglected and summarized globally in the R0 value. Another criticism is directly related to the use of the results: whereas we could expect mathematical evidence to be unambiguous, several countries drew completely different conclusions for their public health policies. The overall model-scientists-politics chain of analysis is also subject to strong variations.
As a conclusion, I would say that having a model at one's disposal is not sufficient. What matters the most is the combined expertise of modelers who and of the domain specialists, who can together give meaning to the results.
Reference
-
Historical data for the world population: https://www.worldometers.info/world-population/world-population-by-year/
-
Study of the SEIR model for the case of Wuhan: H. Wang, Z. Wang, et co-auteurs., "Phase-adjusted estimation of the number of Coronavirus Disease 2019 cases in Wuhan, China", Cell Discovery (volume 6, article 10) 2020. https://doi.org/10.1038/s41421-020-0148-0
Comments !
Comments are temporarily disabled.